Shrinkage and Selection in “Big Data”: Nowcasting the UK Labour Market (2004–2025)
The Problem: The Information Gap
Official UK unemployment statistics from the ONS are the gold standard – but they arrive late. With a publication lag of roughly 6–8 weeks, policymakers, businesses, and analysts are often forced to make decisions using data that already describes the past.
During periods of rapid economic change – such as the 2008 Financial Crisis or the onset of COVID-19 – this delay becomes especially costly. When conditions deteriorate quickly, waiting two months for confirmation means flying blind precisely when timely information matters most.
This gap is what motivates nowcasting – estimating the present (and very near future) before official data is released.
The Solution: Real-Time Intent
This research asks a simple but powerful question: Can real-time online search behaviour help us detect labour-market stress earlier?
Google Trends (GT) provides a continuous, high-frequency signal of what people are actively concerned about. When individuals lose jobs – or fear they might – their behaviour changes immediately. They search for job boards, benefits, retraining, and redundancy rules.
By tracking signals such as:
- Job search activity (e.g. “CV Library”, “Reed”), and
- Economic distress and uncertainty (e.g. “Redundancy”, “Universal Credit”),
we can, in principle, infer labour-market conditions weeks before they appear in official statistics.
The Methodology: Taming “Big Data” with Shrinkage
Google Trends is rich – but messy. The challenge is not too little data, but too much.
This study uses 48 potential predictors, combining:
- Google search terms, topics, and job-site queries,
- traditional economic indicators (such as FTSE volatility), and
- autoregressive unemployment dynamics,
estimated within a 48-month rolling window. This creates a classic high-dimensional setting, where the number of predictors rivals the number of observations – a scenario where standard regression techniques break down.
To address this, I use shrinkage and selection methods – specifically Lasso and Elastic Net – which act like a statistical sieve:
Irrelevant variables are shrunk to zero, while informative signals are retained.
Elastic Net plays a key role here, as it can retain groups of correlated variables, capturing broader economic themes rather than arbitrarily selecting a single search term.
From Selection to Prediction
Once each rolling window identifies its most informative predictors, a post-selection Ordinary Least Squares (OLS) regression is used to generate forecasts.
This two-stage approach combines the best of both worlds:
- machine-learning discipline for variable selection in high-dimensional data, and
- the gold-standard interpretability and unbiased estimation properties of OLS for prediction and evaluation.
(Full mathematical details are provided in the dissertation appendix.)
In-Sample Performance: A Warning on “Overfitting”
Before forecasting the future, it is tempting to look at how well models explain the past.
At first glance, the results are impressive. As shown in Table 1, models augmented with Google Trends dramatically outperform a simple autoregressive benchmark in terms of in-sample fit.
| Model | Average Variables Selected | RMSE | R² | Adjusted R² |
|---|---|---|---|---|
| 1. Benchmark AR(3) | 2.97 | 0.092 | 0.197 | 0.143 |
| 2. AR + Google Trends | 12.65 | 0.059 | 0.661 | 0.540 |
| 3. Full Model (AR + Econ + GT) | 16.97 | 0.049 | 0.760 | 0.624 |
However, this apparent success hides a familiar trap. The sharp drop from standard to reveals a classic overfitting problem – the models are partially memorising noise rather than learning stable relationships.
In short, strong in-sample performance does not guarantee strong forecasts – especially in “Big Data” environments.
The Findings: A Tale of Two Regimes
Out-of-sample results tell a much more nuanced story.
Figure 1 tracks forecasting performance across the full 2004–2025 sample. In simple terms, Panel (a) highlights when the models add value, while Panel (b) shows how much error each model accumulates in total.

Two clear regimes emerge:
1. The Crisis Advantage
During periods of extreme stress – notably the Great Recession and the onset of COVID-19 – Google Trends-augmented models consistently outperform the benchmark.
- Search-based models adapt faster to sudden shocks.
- During COVID-19, a model using only GT data performs almost identically to a much richer economic specification.
- The search term “Redundancy” is selected in roughly 85% of rolling windows, making it the single most reliable predictor.
In crises, real-time behavioural data captures distress before traditional indicators can react.
2. The Recovery Trap
Outside crisis periods, the advantage fades.
During recoveries – particularly post-2010 – GT-augmented models sometimes underperform. This reflects a structural limitation of rolling-window learning – crisis-specific signals remain embedded in the model even as the economy transitions to a new regime, where those signals become misleading.
The Horizon Effect: When Does the Signal Fade?
Another key insight is that timing matters.
Figure 2 shows forecast accuracy across different horizons.
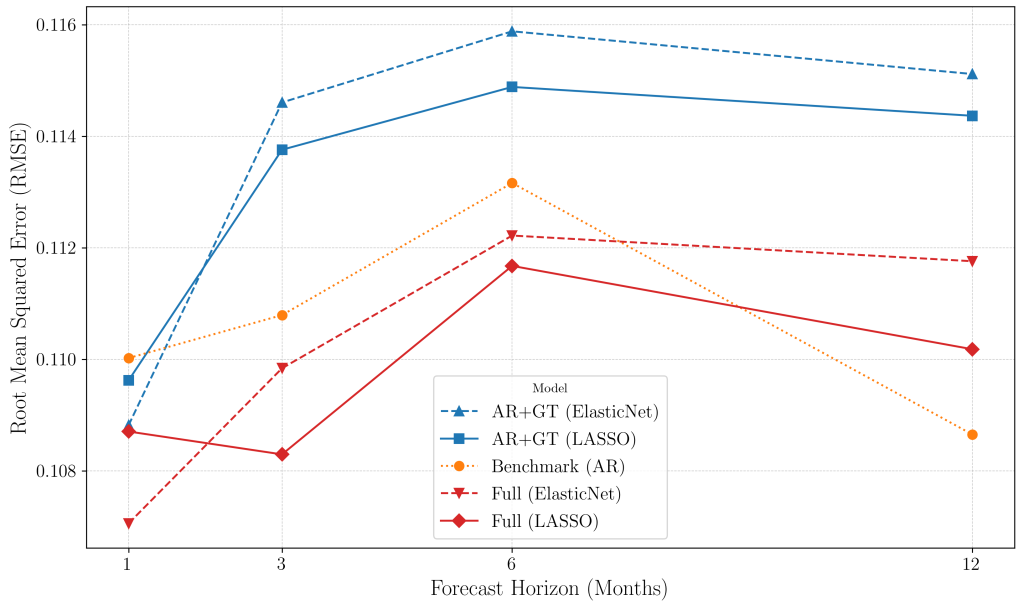
- At a 1-month horizon, GT-augmented models are most effective – excelling at real-time nowcasting.
- As the horizon lengthens, the signal decays.
- By 12 months, the simple autoregressive benchmark outperforms all “Big Data” models.
Search behaviour is excellent for event detection, but it is not designed for long-term structural forecasting.
The Non-Linear Breakthrough
One puzzle remained:
Why were linear GT models visually better during crises, yet rarely statistically significant?
The answer appears to be non-linearity.
Using the top eight variables identified by the linear models, I estimated a Random Forest nowcasting model. The result was decisive:
- Forecast error fell by around 4% relative to the best linear model.
- The improvement was statistically significant.
This suggests the limitation was not the data – but the functional form. The relationship between online search behaviour and unemployment is complex, asymmetric, and regime-dependent. Non-linear models are better equipped to capture it.
The Bottom Line
So, does Google Trends work?
- As a nowcasting tool – yes, especially for detecting turning points and crises in real time.
- As a long-horizon forecaster – no, its signal fades quickly and simpler models dominate.
- As a complement – absolutely. GT acts as an early-warning system, bridging the information gap before official data arrives.
- With non-linear methods – the signal becomes meaningfully stronger.
Used carefully, “Big Data” does not replace economic fundamentals – but it can make them timelier, sharper, and more responsive.
To explore the Python code, datasets, and replication package used in this research, visit the GitHub Repository.
Full dissertation available below:
Leave a Reply