Tomorrow night England play Norway in a World Cup quarter-final, kicking off at 10pm UK time in Miami. The British Beer and Pub Association reckons up to 5.5 million extra pints will be poured, worth £27.5 million to pubs (BBPA, 9 July 2026). VoucherCodes has gone further, putting England’s run at a potential £7.6 billion boost to the UK economy. Numbers like these appear every tournament, and they invite an obvious econometric question: is any of this new economic activity, or are fans simply drinking pints they would otherwise have spent on something else?
The distinction matters. GDP measures net output. If a household’s £40 goes to the pub on Saturday night instead of the retail park on Saturday afternoon, hospitality booms, retail sags, and the aggregate barely moves. That’s reallocation. Stimulus requires people to spend money they would otherwise have saved, or to spend it in ways that mobilise otherwise idle capacity. The pub-spend headlines can’t distinguish the two — but with two completed England tournament runs behind us, the data can get us surprisingly close.
The evidence base: two completed tournaments
World Cup 2022 (Qatar). England played five matches: Iran (Mon 21 Nov, 1pm UK), USA (Fri 25 Nov, 7pm), Wales (Tue 29 Nov, 7pm), Senegal (Sun 4 Dec, 7pm) and a quarter-final defeat to France (Sat 10 Dec, 7pm). A winter tournament, so no summer-weather confound — but a Christmas one instead.
Euro 2024 (Germany). England went all the way to the final: three group games in mid-to-late June, then Slovakia (30 June), Switzerland (6 July), the Netherlands semi-final (Wed 10 July) and the final against Spain (Sun 14 July), all in UK evening slots. England lost the final 2–1.
What match days did to pub tills
The matchday uplifts are real, large and consistently measured.
For the Wales–England game on 29 November 2022, Barclaycard Payments recorded spending at pubs, bars and nightclubs up 20.5% year on year, with restaurants up 13.9%. UKHospitality reported member pubs and bars trading 30–40% above normal on match days that November (January 2023). Barclays’ December 2022 report found pubs, bars and clubs up 12.6% year on year — their strongest month since May 2022 — crediting the World Cup alongside Christmas parties.
Euro 2024 produced even bigger spikes. On the day of the semi-final against the Netherlands, Barclays’ merchant data showed pub transaction volumes up 131.5% year on year and 54.7% above the previous Wednesday. Vianet’s till data, collated with the Oxford Partnership, counted roughly 12.5 million pints across the on-trade that day — about 66% more than the equivalent day in 2023 (Morning Advertiser, 11 July 2024). On final day, Barclays recorded pub and bar transactions roughly tripling versus the same Sunday in 2023, making it the busiest pub Sunday of 2024 by a wide margin.
So far, so brewery-friendly. But that’s the setup, not the finding.
The substitution check
The question is what happened to everything else on those same days and in those same months. Here the picture turns.
Start with Euro 2024. In the very month pub transactions tripled on final day, Barclays’ July 2024 Consumer Spend report showed total consumer card spending falling 0.3% year on year. Entertainment spending dropped 6.1% — Barclays’ own commentary noted that with so many people watching football, other leisure spending suffered. The pub spike is clearly visible in the category data; it is invisible in the aggregate.
Footfall data sharpens the point. MRI Software recorded high-street footfall on final Sunday up 7.3% week on week — but retail parks down 9.4% and shopping centres down 5% on the same day. People didn’t go out more; they went out somewhere else, to places with screens and taps. The Monday after the final, footfall across all UK retail destinations fell 5.5%, a classic intertemporal payback. The whole mechanism fits in one chart:
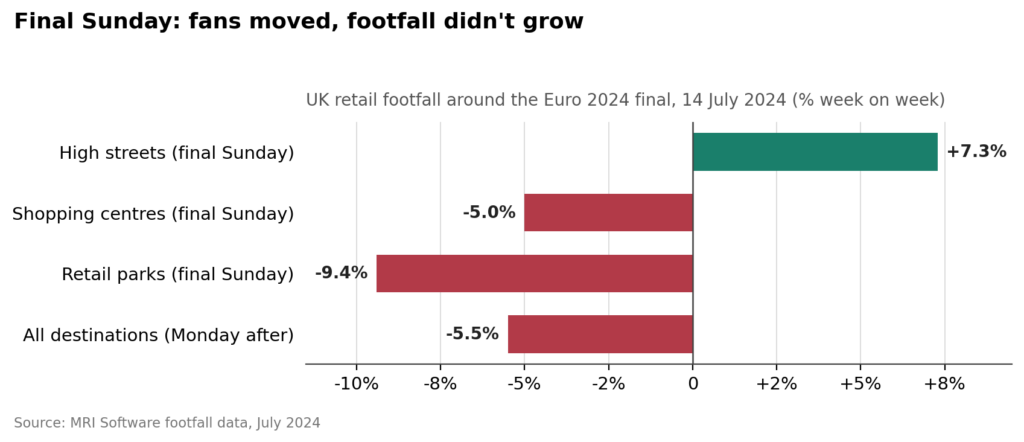
Figure 1: On the day of the Euro 2024 final, footfall rose where the pubs are and fell where the shops are — then everything fell the day after. Substitution across venues and across time, in a single weekend. (Source: MRI Software, July 2024.)
World Cup 2022 tells the same story from within a single ONS release. Monthly GDP for November 2022 (published 13 January 2023) grew 0.1%, and the ONS explicitly flagged food and beverage service activities — up 2.2% — as the largest contributor to consumer-facing services growth in the month the tournament began. But the same bulletin shows retail trade falling 0.4% and sports, amusement and recreation activities falling 3.2%, the latter partly because domestic football paused for Qatar. Hospitality’s gain sat alongside offsetting losses next door, and the whole economy barely moved:
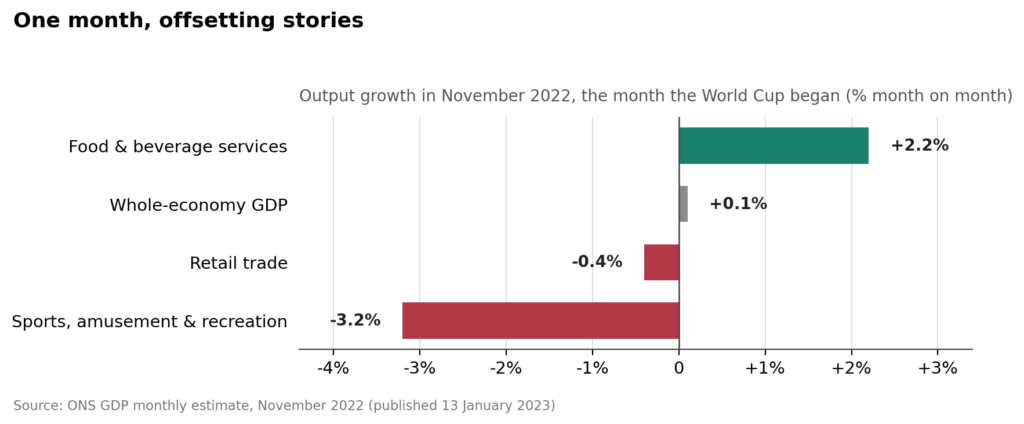
Figure 2: The World Cup effect inside one ONS bulletin — a 2.2% surge in food and beverage services, offset by declines next door, nets out to a 0.1% move in GDP. (Source: ONS GDP monthly estimate, November 2022.)
And in December 2022, Barclays’ overall card spending grew 4.4% in nominal terms against 9.3% inflation — shrinking in real terms even as pubs boomed.
There is one genuine caveat on the stimulus side: ONS retail sales for July 2024 rose 0.5%, with department and sports equipment stores citing the Euros among the drivers — replica shirts and new tellies are tournament-specific purchases that plausibly wouldn’t have happened otherwise. But June 2024, when most of the group stage was played, saw retail sales fall 1.2%. Any tournament-linked retail is small and partly borrowed from adjacent weeks.
The verdict
On the historical record, reallocation, with a small and short-lived net residual at best. The tournament effect shows up in three ledgers at once: across categories (retail and entertainment down while hospitality is up), across venues (retail parks down while high streets are up, on the same day) and across time (the day-after and week-after paybacks). The aggregate barely registers — monthly GDP moved by 0.1% in the World Cup’s strongest month, and total card spending fell outright in Euro 2024’s final month.
This squares with the wider literature. Goldman Sachs economists Kevin Daly and Mambuna Njie, examining every World Cup since 1982, found hosting delivers a statistically insignificant output effect (research note, 3 June 2026), and sports economist Victor Matheson has long argued pre-event impact estimates ignore substitution almost entirely. The one robust positive result is for winning: Mello (Oxford Bulletin of Economics and Statistics, 2024) finds tournament victory lifts year-on-year GDP growth by roughly half a percentage point over two quarters — driven mainly by exports, not pints. Since England have not won since 1966, that channel remains, regrettably, untested on UK data.
2026 so far: a postscript, not a data point
This tournament’s early numbers rhyme with the historical ones, and should be read as provisional. England’s run to date: 4–2 v Croatia (17 June, 9pm UK), 0–0 v Ghana (23 June, 9pm), 2–0 v Panama (27 June, 10pm), 2–1 v DR Congo (1 July, 5pm) and a 3–2 win over Mexico in a 1am kickoff on 6 July, with pubs in England and Wales trading on extended licences.
Dojo’s card data shows pub and bar spending up 72% on opening-match day versus the equivalent day a fortnight earlier, and up 17.3% across England’s first two weeks; Visa puts hospitality roughly 15% up year on year during the group stage, with post-9pm pub spend up 70% on late kickoffs. The Oxford Partnership estimates the group stage added around 6.8 million pints. But the substitution signal is flickering already: MRI Software reports overall UK retail footfall in June 2026 fell 1.3% year on year, with high streets down 3.3% — the activity is concentrating around matches, not obviously growing in total. With only six matches played and no post-tournament payback observable yet, that is an early read, not a verdict. Only time — and a few more ONS releases — will tell how this one shapes up.
What would make this analysis better
The honest limitations: tiny samples (five to seven matches per tournament), heavy confounding (a wet July 2024, a cost-of-living Christmas in 2022, weak 2021 comparison bases), and data assembled from press releases rather than consistent microdata. The ideal test would be transaction-level panel data covering hospitality and retail and savings flows for the same households, on match days versus same-weekday controls, with a window long enough to catch the payback weeks. The ONS’s real-time card-spend indicators get part-way there. Until someone runs that properly, treat every “£X billion boost” headline as a gross figure in search of a net one.
Sources: Barclays/Barclaycard Consumer Spend reports (Dec 2022, Jan 2023, Aug 2024); ONS GDP monthly estimate, Nov 2022 (13 Jan 2023); ONS Retail Sales, Jun–Jul 2024; MRI Software footfall data (Jul 2024, Jul 2026); Vianet/Oxford Partnership via Morning Advertiser (Jul 2024, Jun–Jul 2026); Dojo (Jun–Jul 2026); Visa (Jul 2026); BBPA (Jul 2024, Jul 2026); NTIA (Jul 2026); Goldman Sachs research note (3 Jun 2026); Mello, Oxford Bulletin of Economics and Statistics (2024).
Leave a Reply