View full paper here
The Strategic Importance of Maritime Chokepoints
Over 80% of global goods by volume move by sea, much of it through a few narrow chokepoints. Recent years have highlighted this vulnerability, most notably through the 2021 Suez Canal blockage and Houthi attacks in the Red Sea. For the United States, the Panama Canal is a critical infrastructure component in their huge demand for international trade, linking East and Gulf Coast ports to Asian and South American markets.
Disruption to the Panama Canal
The Panama Canal reduces transportation costs and improves supply chain efficiency by shortening shipping routes, saving roughly 3,000 miles on trips from the U.S. to Japan, for example. Unlike sudden shocks such as groundings or conflicts, the 2023–24 Panama disruption emerged gradually from climate stress, offering a preview of how economies may confront recurring climate-driven trade disruptions.
When drought hit the Panama Canal in 2023, forcing authorities to slash daily ship transits by nearly half, the implications for global trade were significant. The canal handles over 40% of U.S. container traffic—roughly $270 billion in goods annually. Theory suggests that disruptions to such critical trade infrastructure should impose measurable costs on dependent economies through higher transport costs, supply chain frictions, and reduced trade flows.
Analysis of state-level economic data reveals a more nuanced picture than one you might predict. While real costs emerged, modest inflation in exposed regions and some labour market friction, aggregate economic output and employment showed remarkable resilience. Understanding why offers crucial lessons as climate change threatens to make such events more frequent.
Economic Impacts of the Disruption
To assess the economic effects of the Panama Canal disruption, this analysis uses quarterly data from 2022 through early 2025 and applies a difference-in-differences design comparing U.S. states highly exposed to canal traffic with otherwise similar, less-exposed states. The treatment period begins in 2023 Q3, when drought-driven transit restrictions sharply reduced ship crossings.
States are classified as “treated” using quantitative measures of trade dependence on canal routes. The empirical strategy tracks changes in real GDP per capita, unemployment, transportation sector activity, and consumer prices, relying on an identification assumption of parallel pre-disruption trends, which is largely supported by event-study tests.

Figure 1: Control and Treated States
The results point to surprising economic resilience. States most exposed to canal-routed trade show no statistically significant decline in real GDP per capita following the disruption. Nor does the transportation and warehousing sector—the most directly exposed industry—show any decline in its share of state economic activity or employment. These findings suggest that supply chains and logistics networks adjusted more smoothly than expected, either through rerouting, inventory buffers, or contractual rigidities, preventing what might otherwise have been a visible shock to output or labour demand at the regional level.
The clearest impact appears instead in consumer prices. Inflation (CPI) in the most exposed census divisions1 rose by approximately 0.66 percent relative to control regions, a modest but economically meaningful increase. Notably, this effect emerges with a lag of roughly two quarters, consistent with established evidence on shipping cost pass-through. Higher freight costs do not immediately reach consumers but propagate gradually as contracts reset, inventories turn over, and firms adjust pricing strategies.
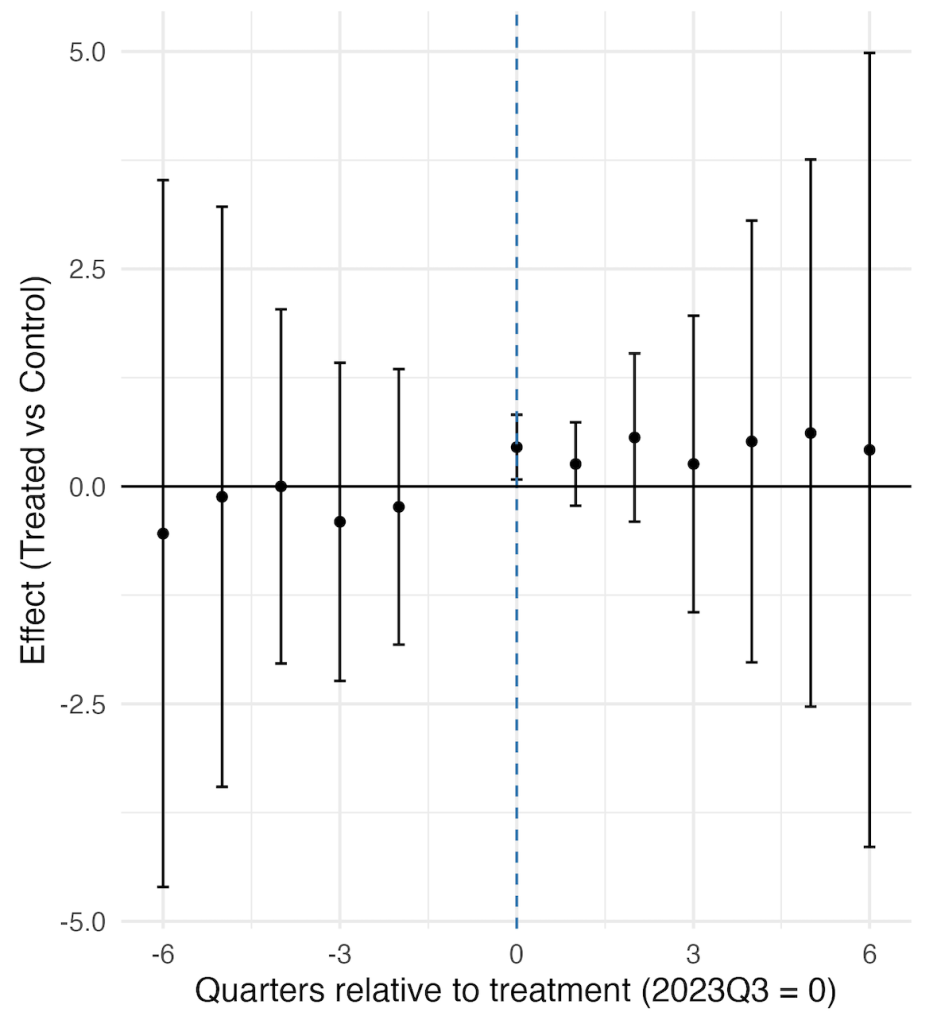
Figure 2: Event-Study Estimates of Disruption Impact on CPI
Evidence of labour market stress is more ambiguous. While the most trade-dependent states experienced unemployment increases of around 0.3 percentage points, these estimates are sensitive to specification and fail several robustness checks. Event-study results suggest some pre-existing divergence in labour market trends, complicating causal interpretation. Taken together, the findings imply that the Panama Canal disruption functioned less as a conventional output shock and more as a cost shock—one that was largely absorbed by quantities and employment but partially passed through into prices.
The Adaptation Mechanism: Evidence from Logistics Data
The absence of measurable output effects is, at first glance, surprising. Both economic theory and historical experience suggest that increases in trade costs should exert downward pressure on production. This apparent contradiction is resolved by examining the response of logistics networks during the disruption. Evidence from multiple data sources indicates that large-scale cargo re-routing served as the primary adjustment mechanism.
Freight rate indices illustrate the economic incentives underlying this response. Shipping costs from Asia to the U.S. East Coast via the Panama Canal rose during the drought period, while West Coast routes, although also experiencing cost increases, remained comparatively less expensive. These relative price changes altered route choice and shipping patterns.
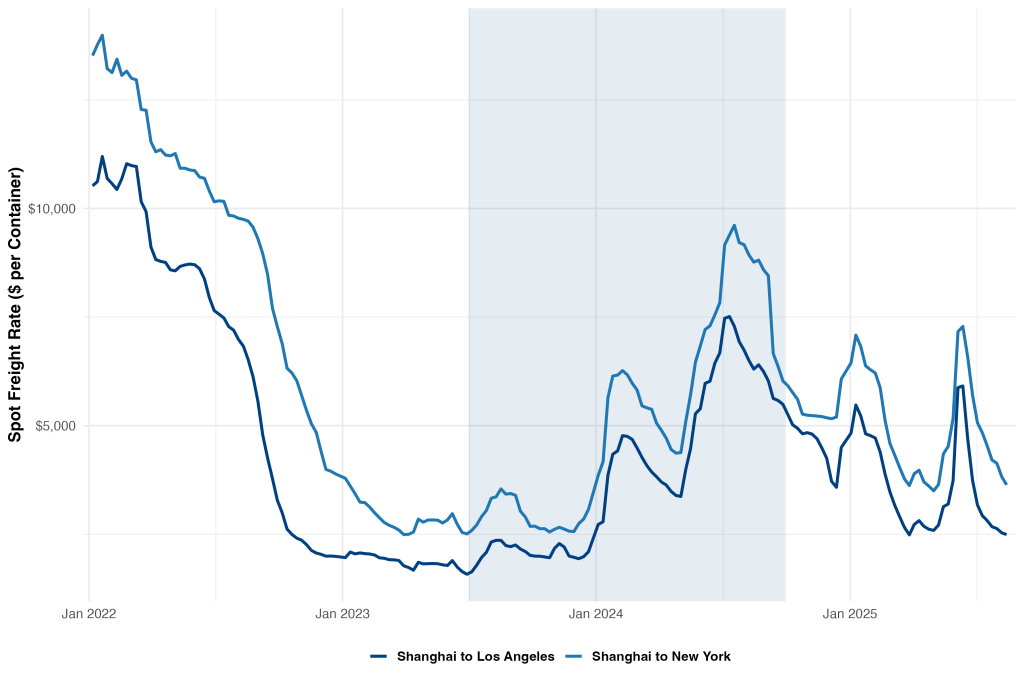
Figure 3: Freight Rate Comparison East Coast vs West Coast
Port throughput data confirm that cargo flows responded to these incentives. Container volumes at the Port of Los Angeles increased during the disruption, while East Coast ports, including Savannah, experienced relative softening in activity. This shift indicates a redirection of maritime arrivals toward West Coast entry points.
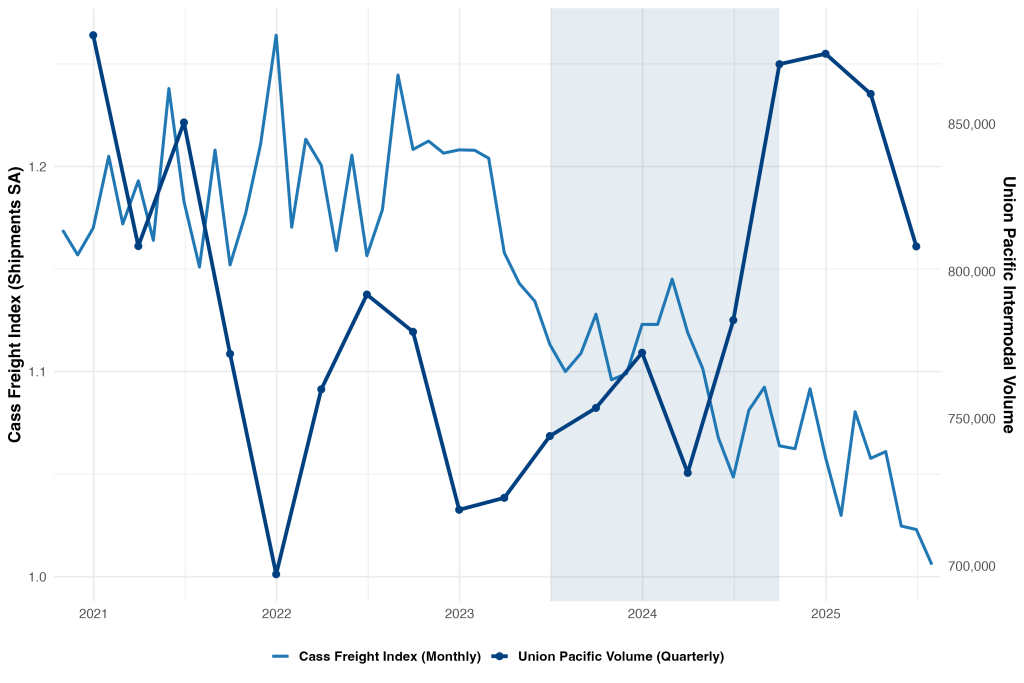
Figure 4: Shipping vs Intermodal Volume
The final link in this adjustment process appears in intermodal rail traffic (Figure 4). Union Pacific’s intermodal unit volumes rose markedly over the same period, suggesting that containers arriving at West Coast ports were subsequently transported inland and eastward by rail rather than serving only regional markets. Although this re-routing entailed higher costs in the form of longer transit times, elevated freight rates, and additional handling, it prevented the emergence of a binding bottleneck. In effect, the U.S. logistics system absorbed the shock by redistributing flows spatially rather than allowing congestion to accumulate at a single point of failure.
Implications
The 2023–24 Panama Canal disruption demonstrates that the U.S. economy currently possesses substantial capacity to absorb major trade infrastructure shocks without experiencing broad-based declines in output or employment. Adjustment occurred primarily through logistics reconfiguration rather than through contraction in economic activity, with higher transport costs passed through gradually into consumer prices. The result was a modest but measurable increase in regional inflation, while physical trade volumes and production remained largely intact. This episode highlights the economic value of infrastructure redundancy and multimodal transport flexibility as core components of macroeconomic resilience.
However, this resilience should not be interpreted as automatic or costless. Climate-driven stress on critical trade infrastructure is likely to intensify, particularly for water-dependent systems such as the Panama Canal. Preserving adaptive capacity will require sustained investment in port and rail capacity, water management, and system-wide monitoring and contingency planning. Policy should focus on strengthening network flexibility and route diversification rather than optimising for single-route efficiency, while recognising that future disruptions may impose larger and more unevenly distributed costs across regions and sectors.
- Due to data availability constraints, consumer price index analysis was conducted at the census division level rather than the state level, with divisions classified as treated or control based on their constituent states’ exposure to canal-dependent trade flows. ↩︎
Full dissertation available below :
Leave a Reply